Supply Chain Market Research - SCMR LLC
  • Blog
  • Home
  • About us
  • Contact

Polinat & TCL

8/12/2022

0 Comments


Polinat & TCL
​

As analysts we always look for anecdotal evidence that what we feel is true is actually a valid hypothesis, but most times that evidence is hard to come by…and other times it’s not.   Given our longstanding experience with the CE and display space we tend to get a feeling that something is going to happen before it actually does, and while we are certainly wrong (on occasion) or misjudge timing, having closely followed the display space for over 18 years gives us some sense of intuition about how things will play out.  While the industry bemoans about how deeply it had to cut utilization to try to manage inventories and keep panel prices from dipping so far below cash costs that it was not worth turning the power on, we saw this issue as the potential solution to the very problems the industry had created for itself.
The necessity for lower utilization rates at panel producers, be it LCD or OLED, is a function of the classic imbalance between capacity and demand, and while there are many ways in which demand can be influenced, supply/capacity, especially in the display space, where greenfield capacity has a high capital cost and process equipment has long lead times, needs years to plan and complete, which means panel producers must anticipate industry and macro conditions years in advance.  Such advanced planning is fraught with influences that color panel producer views and complicate the process further and such can push a short-term or long-term roadmap toward a postponement or eventual cancellation, or worse, an idle or under used facility.
The threat of competition is certainly one ‘influencer’ in the capacity decision making process, but there is competition in every business.  In the case of the display business however there is another kind of competition that we believe is, and has been, a major factor in exaggerating the cyclical nature of the panel business, and that is political nationalism (aka ‘polinat’ – you heard it here first ☺).  Under our definition, polinat is the influence of politics in a country’s desire to be recognized globally, which puts the government’s necessity to gain global acceptance above that of the populous and can be a significant influence on a country’s economic and business outlook, depending on the political system.  Over the last 12+ years the Chinese government has had a significant influence on the display space through government sponsored funding of display capacity, which was readily accepted by panel producers.
The plentiful funding, which typically comes from provincial or city owned entities, has allowed Chinese panel producers to expand capacity at an unprecedented rate, which in many cases had little to do with supply/demand and more to do with a desire to cement China’s place in an industry that has previously been dominated by other Asian competitors.  Underlying this political nationalism has been good old company rivalry between Chinese panel producers themselves, which has served to aggravate the situation.  The Chinese display industry has been focused on chasing market share since its inception and now is the dominant force in the LCD display space, and has built out very significant capacity under the assumption that the LCD display business will continue to grow, with China the dominant force behind that growth. 
This enthusiastic capacity expansion was reinforced during the COVID-19 pandemic, as panel prices rose under unusual demand circumstances and most panel producers became profitable.  This positive justification led to further expansion planning under the assumption that we were living in a ‘new’ demand environment and funding continued, even after panel prices began to deteriorate in July of last year, and while TV panels pricing declined rapidly, panel producers continued to justify those expansion plans citing the mantra that IT panel pricing (monitors, notebooks, and tablets) remained strong.  Unfortunately that IT panel price stability was not sustainable given the fact that most panel producers shifted capacity from TV panel production to IT panel production as TV panel prices deteriorated, which caused IT panel prices to deteriorate, especially as demand weakened.
Little has been said during the 1st half of this year about previously announced expansion plans, but we expect much has been said internally and most recently a trip by the chairman of TCL (000100.CH) the owner of China’s 2nd largest panel producer Chinastar (pvt), visited South Korea to meet with Korean equipment suppliers to discuss ‘the current state of the industry’.  According to the South Korean trade press, those discussion were focused around the TCL chairman explaining to equipment suppliers that delayed payments and timeline pushbacks were the result of the overall weakness in the display market and to discuss the feasibility of changing the format of some of the equipment from small panel OLED (Gen 6) to Gen 8 in order to move more toward the production of IT OLED panels and away from those for smartphones.
Equipment producers were told that Chinastar’s T5 Gen 6 LCD fab in Wuhan that TCL announced late last year would be expanded, has delayed the expansion until 2023 and the company’s T9 Gen 8.6 LCD fab project in Guangzhou will also be postponed for 6 months, apologizing for the delay in progress payments.  This is a sensitive subject for South Korean equipment suppliers as we mentioned in notes on 12/29/20 and 6/1/21, as a company known as Jiangxi Infintech Optoelectronics (defunct) has ordered roughly $77m from a number of South Korean suppliers for a $3.5b mixed use LCD/OLED Gen 6 fab it was planning to build in 2018.  After multiple delivery pushouts and little, if any payments, the company’s management abandon the project and left the country leaving South Korean equipment vendors with raw materials and project expenses that were never paid and the expensive task of trying to recover funds through the Chinese courts.
TCL is lucky in that Samsung Display (pvt) has a 12.3% share in TCL, which it purchased when it sold its LCD fab in Suzhou to Chinastar in August 2020.  This gives TCL considerable credibility with Korean suppliers, but more importantly the delays in TCL’s display expansion projects are indicative of the theory that the idea that helter-skelter expansion might not be the only way to prove a country’s ability to compete in the world market, and that the concept of ‘If you build it they will come’ was a line form a movie and not necessarily a motivation for spending billions of dollars.  The continued expansion of LCD production capacity through 2023 and 2024 against a more moderate demand cycle was one that give us little hope for more than modest sales gains for the industry and as that philosophy spread to the OLED space, the same fate, out a few years further, was also inevitable, but a more rational view of capacity now seems to be starting to take hold with the TCL chairman’s trip a good omen.
That said, we still have to account for the political nationalism that exists in China which is exacerbated by anti-China political rhetoric in the US.  Historically capacity delays tend to disappear at the first sign of rising prices and while Samsung Display made the hard decision to exit the large panel display business years ago and LG Display (LPL) has been following a similar path, that decision seemed a very wise decision in 4Q 2019 and a terrible one in July 2021.  The underlying price competition from Chinese LCD producers that caused such decisions, a function of the Chinese desire to prove its global worth by dominating a space that had been controlled by it political and regional rivals, still exists and our concern is that while we take the TCL/Chinastar postponements as anecdotal evidence that there is potential for more rational display capacity expansion planning in China, changing a mindset is a difficult task that either takes a long time or is forced economically.  While we prefer the former and abhor the idea of an extended downturn in the display and CE space, sometimes it takes being hit over the head to figure out that you are the one doing the hitting.
Picture
Display Revenue Share - 2010 - 2022 YTD - Source: SCMR LLC, Displaysearch, IHS, Witsview, Company Data
Picture
Aggregate TV/IT Panel Pricing - 2019 - 2022 YTD - Source: SCMR LLC, IHS, Witsview, Company Data
0 Comments

Taiwan Panel Stuff – July Implications

8/10/2022

0 Comments


Taiwan Panel Stuff – July Implications
​

As always we look at panel sales as an indicator toward the health of the CE space given the relative high percentage of BOM that displays represent in most CE products, but much data on CE product shipments is gathered quarterly, we focus more on data that we can gather on a monthly basis in order to gain insight into the trends that will be affecting quarterly and yearly industry and company results.  While in the US and many other countries there is no requirement that companies report monthly sales to investors, there are such rules in Taiwan, which is the reason for our focus on Taiwan based panel producers AU Optronics (2409.TT), Innolux (3481.TT), and Hannstar (6116.TT), particularly AUO and Innolux, as they are both large panel producers, while Hannstar is primarily a small panel producer. 
AU Optronics reported July sales of NT$17.43b ($582.3m US), down 15.8% m/m and down 47.7% y/y against a 5 year July average of -0.5% m/m.  This continues the monthly downward trend which began in July of last year as seen in Figure 1.  AUO also reported shipment area of 1.3m m2, down 18.2% m/m and down 38.1% y/y, the lowest monthly shipment area since AUO began reporting such data.  This is indicative of the weak customer demand and the resulting utilization cuts that have been plaguing the display space since the end of 1Q, and give some indication as to the extent of those utilization cuts.  Based on 19 months of shipment area data, the average monthly shipment area is 2.0m m2/month, with the July data down 35% from that number and down 42.9% from the peak (12/2021), and also down 29.0% from the average shipment area for this year (1.83m m2/month). 
While it is difficult to disaggregate reduced customer demand and intentional utilization cuts, we estimate that AUO has reduced their utilization rate by between 25% and 30% this year, after being close to 100% for much of 2021.  That said, AUO has been able to maintain a relatively stable sales/m2 since the beginning of this year, albeit down from 2021, indicating that the lines that are still in operation are generating 6.1% less sales than they were during last year’s 1st half, likely a result of producers having less choice as to what jobs they take on, meaning settling for less profitable products to fill existing lines.
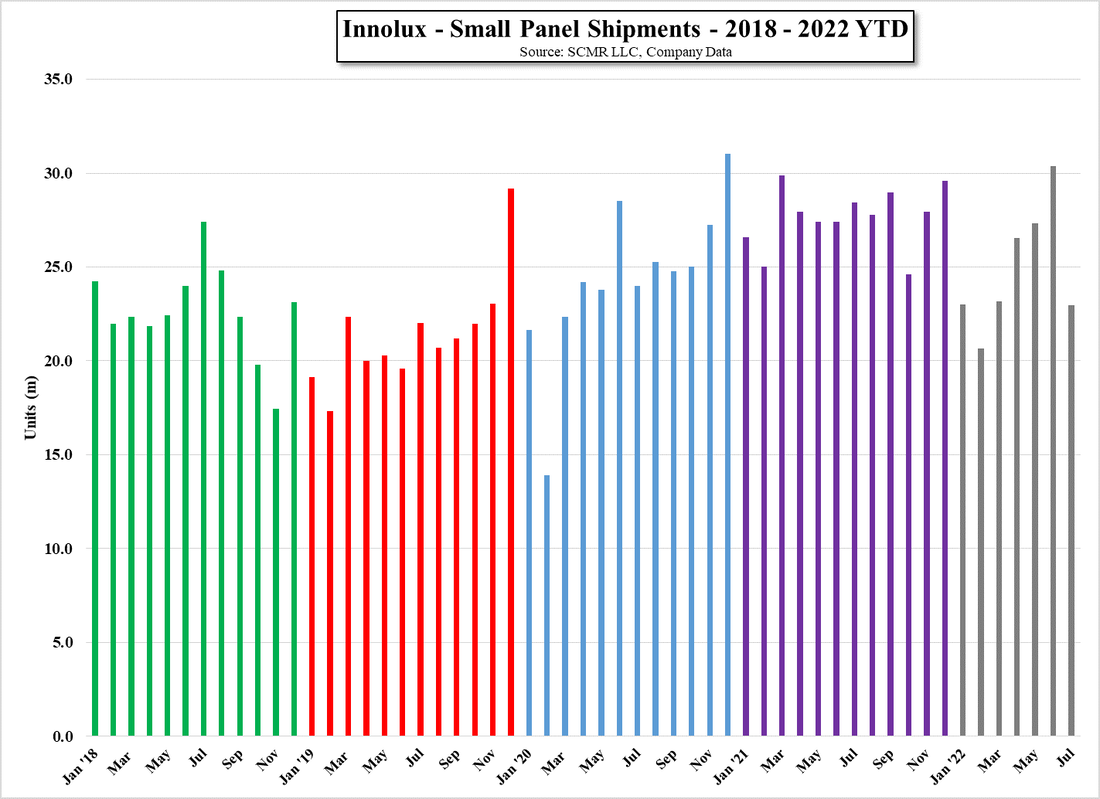
Innolux, Taiwan’s other large panel producer reported sales of NT$15.760b ($526.5b US), down 18.3% m/m and down 51.1% y/y against a 5 year average for July of down 2.2% m/m.   Large panel shipments were 8.25m, down 26.2% m/m and down 32.8% y/y, the lowest large panel unit volume since February 2020, as seen in Figure 4, with small panel shipments of 22.97m units, down 24.4% m/m and down 19.3% y/y (Figure 5), putting total shipments down 24.9% m/m and down 23.3% y/y.  We believe Innolux has waited a bit longer than most to become more aggressive as to lowering utilization and pulled back large panel production to a larger degree in 3Q.
All in, the effects of lower utilization rates at Taiwanese large panel producers are now becoming more apparent in their monthly sales, while still facing weak panel pricing as Chinese LCD panel producers continue to offer panel price discounts to fill fabs.  We expect a little help over the next month or so from easing raw material and component costs, but expect it will take some time for those cost reductions to filter through the display supply chain.  Given that panel inventory was certainly higher than normal exiting 2Q, we expect it will take the rest of August at least, to work that down to more realistic levels, which would imply that utilization cuts will remain in place for this month, although we do not expect additional cuts in September from most large panel producers.    We believe the holiday season will still be lackluster, but even a small improvement in inflation could help to lift consumer spirits enough to at least keep 4Q in the CE space from declining q/q.  It is still hard to get optimistic about the remainder of this year, but at least we can see the possibility that there are a few scenarios where 2023 sees some y/y upside.
Picture
AU Optronics - Monthly Sales - 2018 - 2022 YTD - Source: SCMR LLC, Company Data
Picture
AU Optronics - Shipment Area & Sales/m2 - Source: SCMR LLC, Company Data
Picture
Innolux _ Monthly Sales - 2018 - 2022 YTD - Source: SCMR LLC, Company Data
Picture
Innolux - Large Panel Shipments - 2018 - 2022 YTD - Source: SCMR LLC, Company Data
Picture
Innolux - Small Panel Shipments - 2018 - 2022 YTD - Source: SCMR LLC, Company Data
0 Comments

AU Optronics et al.

7/29/2022

0 Comments


AU Optronics et al.
​

AU Optronics (2409.TT) reported 2Q results as previously noted, down 22.9% q/q and XXX y/y, generating an operating loss.  2Q weaker sales and profits were the result of lockdowns in China and weaker IT product demand from customers who have higher than normal inventory levels, which is predicament that most panel manufacturers faced and AUO was no exception.  The company has lowered its utilization rate (area) to ~70% and will ‘dynamically adjust’ that rate in 3Q, which means they have not set goals, other than to look at each product line and decide if they can generate a profit or positive cash flow before deciding to produce that product in 3Q.  While this sounds like something that should be done on a regular basis, when utilization and profitability is high there are some products that panel producers will run to satisfy large customers, even if they run negative CF.  Given the direr macro circumstances, that perspective has changed.
The company has guided to a decline in shipment for 3Q of between 14% and 16% although they expect ASP (area basis) to be flat based on mix changes, essentially focusing on those products that are in the premium segment of the display market, with automotive and medical singled out.  On a general basis management indicated that they are beginning to see raw material prices stabilize or decline and while transportation costs are still high, many of the logistic bottlenecks have abated.  While this is a positive for the company (and the industry) and is expected to lead to a 2% to 3% cost reduction in 3Q, the easing of transport bottlenecks also pushed more inventory into the channel in 2Q, which now has to be digested by customers and has forced the utilization reductions that are expected to continue in August.
On a medium-term basis, AUO has decided to reduce it capex for the 2022 year by 20%, from NT$45b ($1.5b US) to NT$36b ($1.2b US) and has delayed plans to build a new Gen 8.6 LCD fab until a better picture of the demand cycle becomes available.  The company did indicate that it intends to increase its exposure to the automotive display market, which is seeing improving demand and will continue to grow its ‘non-display’ businesses to offset the cyclicality of the display market.  Figure 1 shows the breakdown by product category of AUO’s revenue with TV declining from over 38% in 2Q ’18 to 16% in 2Q ’22 and the combined commercial, automotive, public display and other category moving from 20% in 2Q ’18 to 43% in 2Q ’22.  While this has helped AUO through various product category weak cycles, the overall weakness in the TV and IT display space in 2Q was great enough to generate losses.
All in, the quarter was generally as expected for AUO and the call rhetoric seems to indicate that while the company would like to be optimistic (they are hoping that brand discounting will burn through excess inventory quickly), they are unsure as to how long this scenario will last, and the capex cut is indicative of that concern.  AUO has responded well relative to competitive challenges from Chinese panel producers over the last two years by focusing away from generic panel production, but with almost all other panel producers now under pressure to find more profitable display products, will likely face increased challenges over product differentiation and capex could shift back to upgrading existing fabs to become more specialized and away from overall capacity expansion given the excess capacity currently existing in the display space.  It was a difficult quarter for AUO and the industry, and it looks like 3Q has started off in the same way, although we expect 3Q to end a bit better than it began and 4Q is going to be a reflection of consumer psychology heading into the holidays, which, given the rapidity in which the macro environment changed in 2Q, seems light years away and equally unpredictable.
Picture
AU Optronics Product Revenue Breakdown - Source: SCMR LLC, Company Data
0 Comments

LG Display – 2Q Notes on LCD & OLED

7/27/2022

0 Comments


LG Display – 2Q Notes on LCD & OLED
​

LG Display (LPL) reported 2Q results of 5.607t won ($4.278b US), down 13.4% q/q and down 19.5% y/y.  Operating income was a loss of 488b won ($372.4m US), the first quarterly operating loss since 2Q 2020.  Gross margins declined from 12.6% in 1Q to 4.9% in 2Q, against 20.8% in 2Q last year as volumes decreased and panel prices declined.  Little in the basic numbers was a surprise although for the first time in the last 4 quarters, the percentage of revenue generated by the production of TV panels increased, although likely as a result of IT panel shipments and prices slowing more rapidly.  On an area basis LG Display saw both shipments and capacity decline, which has been the case since 4Q 2021, with the area utilization rate rising slightly from last quarter’s low of 70.4%.  We note this is not full fab utilization, meaning against the total capacity of the fab, but against the area currently being used.
Picture
LG Display Sales &Cumulative Average - 2018 - 2022 YTD - Source: SCMR LLC, Company Data
Picture
LG Display - TV Revenue Share - 2018 - 2022 YTD - Source: SCMR LLC, Company Data
Picture
LG Display Shipment/Capacity, Utilization by Area - 2018 - 2022 YTD - Source: SCMR LLC, Company Data
The company attributed the weakness to soft demand, weak LCD panel prices, and disruptions in the supply chain in China, resulting in lower LCD panel utilization and shipments, although OLED TV shipments were up in the quarter, a ray of hope for OLED emitter supplier Universal Display (OLED) that derives material sales and unit price royalties from LGD.  OLED TV sales were up ~25% y/y in the 1st half, however the company is forecasting that while there will be OLED TV shipment growth in 2H, it will be at a slower pace than in 1H,, likely closer to 13% to 17% as retailers are expected to order more cautiously in 2H.
In that same vein, inventory levels increased in 2Q by 11.6%, which is concerning considering the company is forecasting continued soft demand at both TV set manufacturers and retailers as a result of excessive inventory levels at those points in the supply chain.  The rational, despite the company’s expected further reductions in utilization were based on new model introductions and the potential need for higher inventory levels heading into the holiday build period, although Figure 4 would indicate that such levels are out of line with historic norms, with the company indicating it expects to return to more normal inventory levels by the end of the year.  We expect some of the inventory build in 3Q is related to the company’s display supply contracts with Apple (AAPL) for the upcoming iPhone, but no specifics were given.
Guidance for 3Q was a bit more specific, with area shipments projected to be up between 4% and 6% q/q as IT and OLED shipments recover, and ASPs (Area basis) increase as the share of smartphones and wearables, which carry higher profitability on an area basis, increase in 3Q, but at the same time the company was forecasting IT panel prices to continue to decline and TV panel prices to also continue to decline, but at a more gradual rate as other LCD panel producers continue to lower utilization rates.
Picture
LG Display - Sales vs. Inventory - Source: SCMR LLC, Company Data
As the risk levels for panel manufacturers rises most companies indicate a desire to expand their product lines away from more generic LCD IT and TV panels and to more value-added displays that are both less competitive and carry higher margins, and LGD indicated the same mantra, with a focus on expanding its already market leading automotive display penetration while increasing both its OLED TV penetration rate and expanding what it calls a ‘made to order’ business, which we assume to mean more product co-development with large customers. 
Much of this is the same corporate speak that appears when the macro environment begins to sour, and should be addressed more closely when things are going well, but LG Display, along with Samsung Display (pvt) has been in the camp of winding down its large panel LCD production for the last few years, although at a much slower pace than their rival.  This brought up the question of the company’s plans for that process, with LGD being a bit more open about plans for their LCD large panel business.  The company’s largest production line known as P7 is a Gen 7.5 a-Si LCD line that was built to produce 225,000 sheets/month.  The company has already brought capacity down to 150,000 sheets and plans to reduce that by another 60,000 during 2H and another 30,000 in the 1st half of next year.  The original plan was to end all production by the end of next year but the company has indicated that they will likely accelerate that process now that large panel prices have been declining.
While we understand that LGD has supply contracts with customers that it must fulfill, and certainly does not want to maintain fabs that run at a small portion of stated capacity, we have been surprised as to how long it took for the company to make the decision to accelerate the wind-down process, with the company stating that the fab had been running at high utilization rates, but as of last July (2021) large panel prices began to decline at a rapid pace and it seemed inevitable that the high utilization rates of 1H 2020 were not sustainable, at which point the push to cut large panel exposure should have been made.  The company did indicate that its Gen 8 fab in Guangzhou China will not be closed but will be converted to the production of smaller IT panels, rather than larger TV panels, for which 10% - 15% has already been completed, with the remainder by the end of 2H next year, which will reduce the company’s exposure to large panel production by 40% (their number).  Other company fabs in Korea, which are Gen 5 and Gen 6 are already oriented toward IT panel production.  The company indicated that the profitability of its IT panel production declined in 2Q but saw less impact than the overall market due to its focus on high-end products.
While the question was asked about plans for expansion of the company’s OLED TV capacity, no answer was given other than the general reference to the development of new OLED oriented products (including automotive), but more importantly when asked about the on-again off-again negotiations with Samsung Electronics (005930.KS) concerning that company’s purchase of multiple millions of OLED TV panels, management indicated that such negotiations had taken place but there was nothing in progress, followed by the more general comment that the company would negotiate with any major customer ‘as long as they recognized value’, which would seem to indicate that price negotiations between the two did not end well.
The circumstances under which panel producers such as LG Display had to operate in 2Q were difficult, but not unexpected and we are always surprised at how slowly pane producers react to what seemed an inevitable conclusion as to panel prices, both TV and IT, and now that the inevitable has occurred panel producers seem a bit surprised at how rapidly things deteriorated, although few were complaining when pane prices were rising rapidly and hitting unprecedented heights.   Now it seems everyone, LGD included, have gained ‘religion’ and are looking at a more conservative approach to production and longer-term plans.  Of course it is easy to me an arm-chair quarterback but there is one consistency in the CE space and that is history repeats itself, so when things like prices get far out of line with historic norms, the elastic band always snaps back, so we wonder if those being ‘snapped’ really thought things were really at ‘a new normal’ or they just did not want to think about anything other than near-term prospects.  Its actually not that hard to answer.
Picture
Aggregate TV/IT Panel Pricing - 2019 - 2022 YTD - Source: SCMR LLC, IHS, Witsview, Company Data
0 Comments

Displays – Was 2Q the Bottom?

7/22/2022

0 Comments


Displays – Was 2Q the Bottom?
​

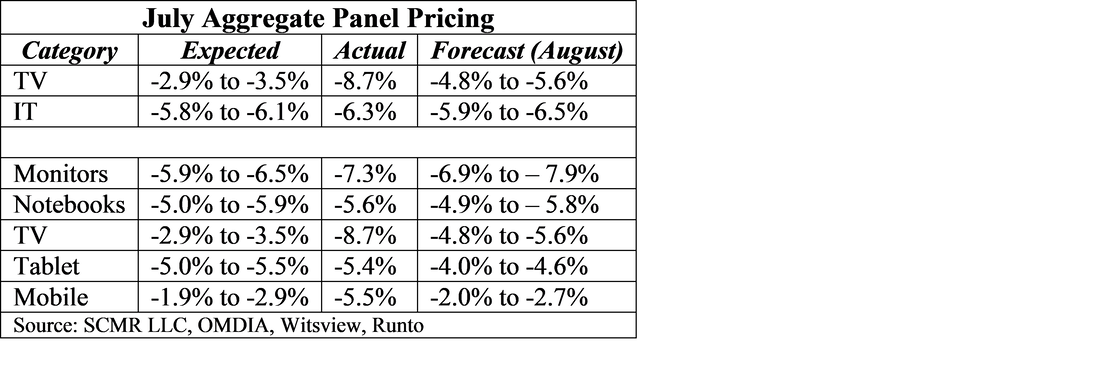
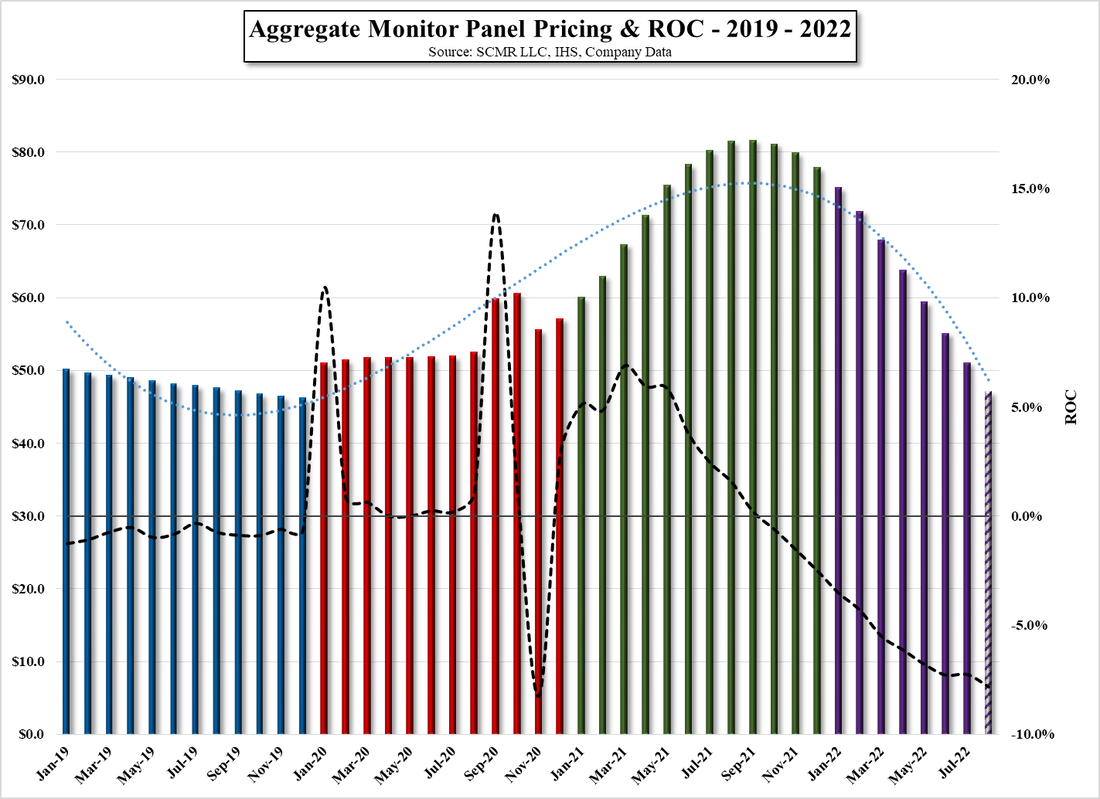
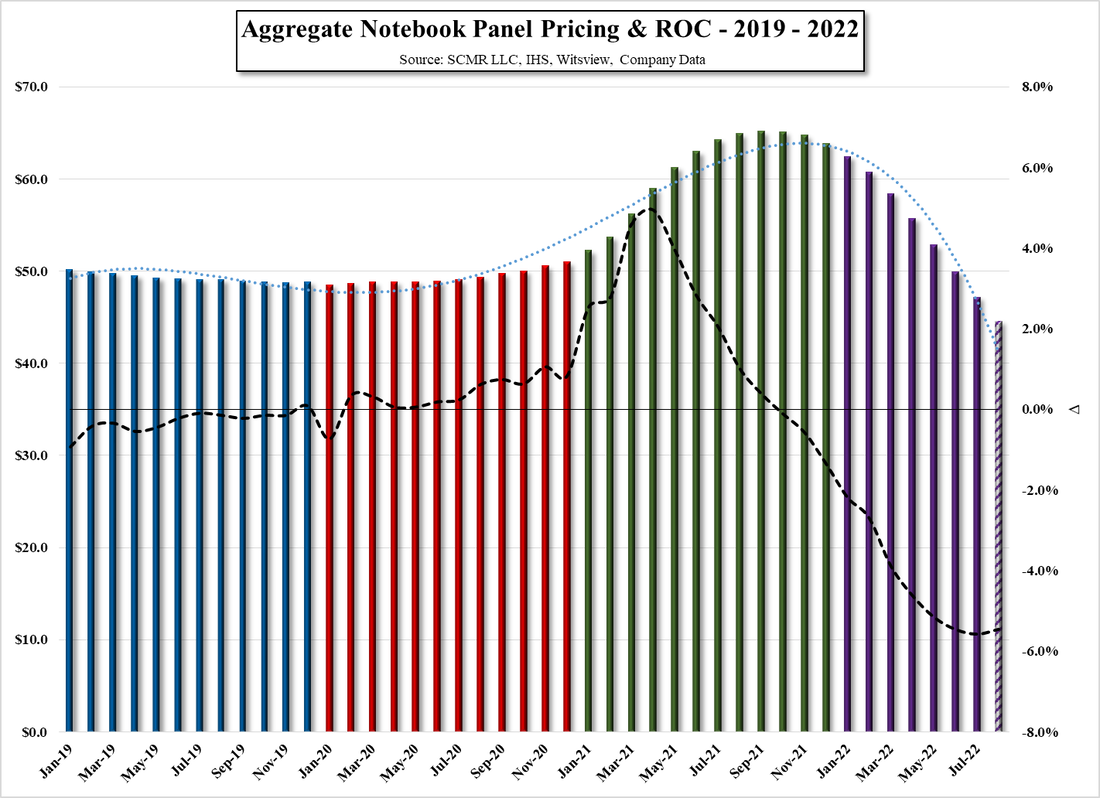
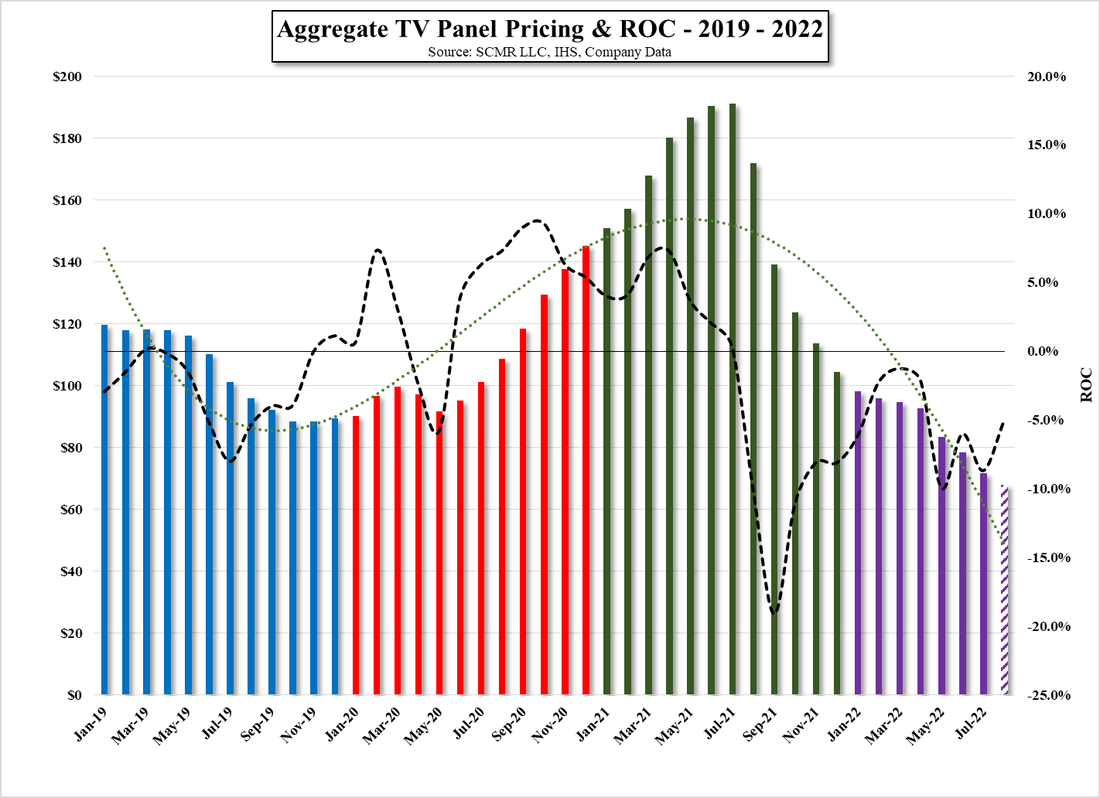
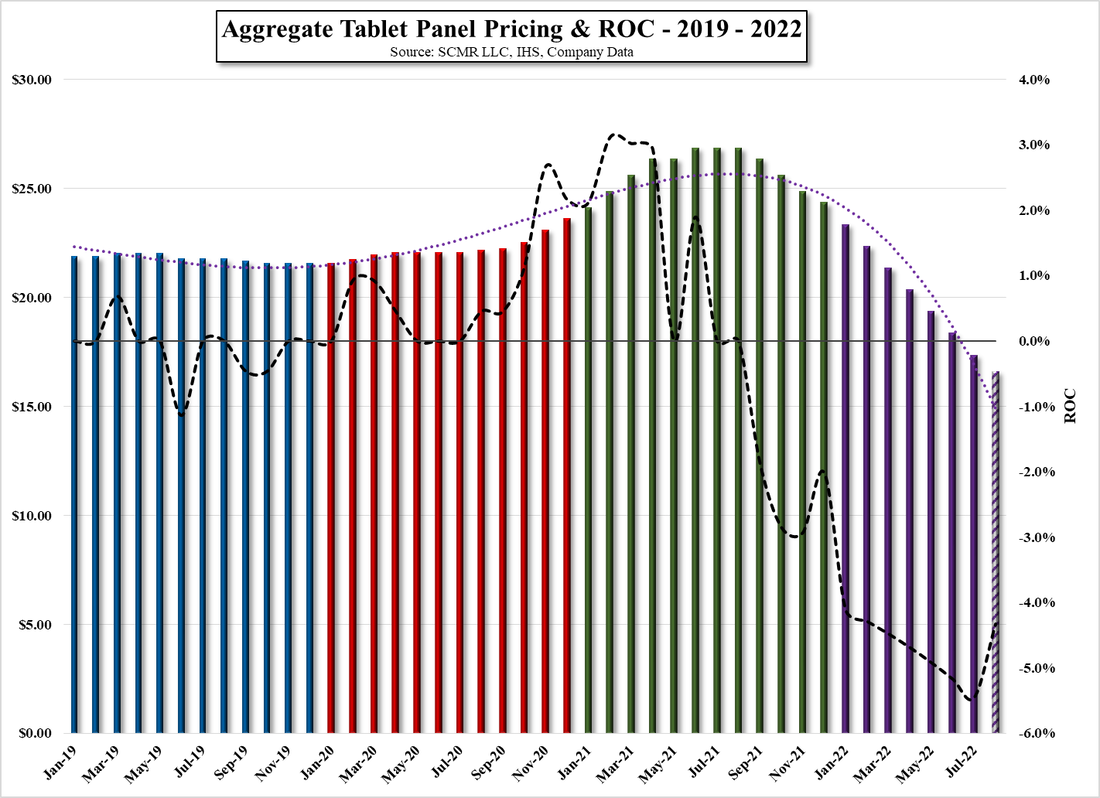
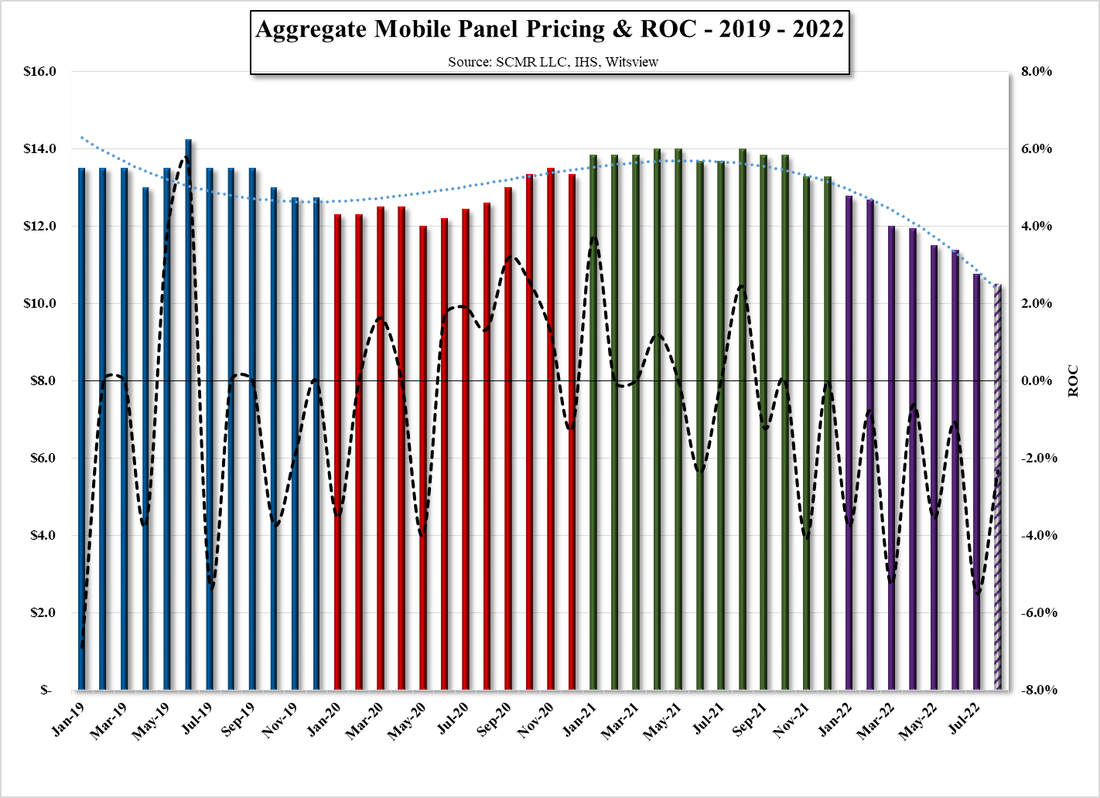
CE brands have been reducing orders as demand slows across many product lines as they try to work off the excess inventory that was accumulated earlier this year when a more optimistic view of demand still reigned.  Panel producers have in turn, lowered utilization rates but at least in July those reductions were not enough to take pressure off panel prices, which declined substantially in July and are expected to decline again in August (see table below).  As we have noted previously we believe that the utilization cuts made by panel producers in June were minimal and the continued decline in July large panel prices bares that out.  Monitor and TV panel pricing was worse than our forecasts, with TV, which had seemed to be seeing a slowing rate of decline, fell 8.7% for the month, far above our -2.9% to -3.5% estimate, and the overall IT segment coming in worse than our range and our August forecasts call for similar declines in almost all product categories.
Based on July large panel pricing all display categories are at or below their 3 year lows which brings up the question of at what point will such low panel prices begin to stimulate demand.  Declining panel prices boosted notebook (+9.7% m/m) and tablet (+15.7% m/m) shipments in June and the overall large panel display space saw a 0.8% m/m increase in sales, and while that could begin to paint a picture of a bottom, we expect July sales to decline as brands cut targets further and panel producers get more aggressive toward discounts in order to maintain current utilization levels.  With large panel prices expected to fall again in August, it would be hard to be optimistic in the near-term, although display sales should see a modest seasonal pick-up in September, but even with some improvements in logistical costs, we would expect more of a bounce along the bottom rather than an easily definable recovery.
While there are many mitigating factors that could change over the next few months, we are a bit more optimistic about 2023 in the display space, although we temper that feeling with the inherent overcapacity in large panel production and a careful definition of what a ‘better year’ might look like.  We expect a return to a more normalized 1st/2nd half split but do not expect more than a modest y/y sales recovery in 2023, with most of the profit leverage coming from reductions in raw material and component prices and less from improving demand.  We expect panel prices to begin to stabilize in late 1Q or early 2Q, but to remain at pre-pandemic levels.  The timing will depend on how aggressive brands will be during the holidays, essentially how willing they are to sacrifice margin to return inventory levels to pre-pandemic norms, and inflation/recession fears at the consumer level.
Calling the bottom of the display cycle here seems premature as there is a considerable likelihood that the industry will see sales declines in the near-term and while some might consider our modestly optimistic view of 2023 a recovery, we see it more as a return to what existed before COVID-19, warts and all and more a return to the industry status quo than a recovery.  Maybe our perspective is a bit biased toward the glass half empty here, but at this juncture it is hard to see what would fill the glass.
Picture
Picture
Aggregate Monitor Panel Pricing & ROC - 2019 - 2022 - Source: SCMR LLC, IHS, Company Data
Picture
Aggregate Notebook Panel Pricing & ROC - 2019 - 2022 - Source: SCMR LLC, IHS, Witsview, Company Data
Picture
Aggregate TV Panel Pricing & ROC - 2019 - 2022 - Source: SCMR LLC, IHS, Company Data
Picture
Aggregate Tablet Panel Pricing & ROC - 2019 - 2022 - Source: SCMR LLC, IHS, Company Data
Picture
Aggregate Mobile Panel Pricing & ROC - 2019 - 2022 - Source: SCMR LLC, IHS, Company Data
0 Comments

Simple Question…

7/21/2022

0 Comments


Simple Question…
​

Investing in Chinese companies can be a harrowing experience, with listing requirements varying between exchanges and financial oversight a challenge for both investors and regulators who can find themselves up against corporate structures that make parsing financials a Columbo-like endeavor rather than a numbers oriented session.  But there is one aspect of investing in Chinese companies that opens up a new venue for investors that is not available in the US and that is the Q&A platforms sponsored by the exchanges that allow investors or potential investors to directly ask questions of company managements on a daily basis.  Based on the companies we follow on the Shenzhen and similar exchanges, company responses vary considerably in response time and depth, and many are just platitudes with little substance, but where face-to-face questions asked of managements might be indirect and circuitous, on-line questions tend to be quite direct, and while the answers can dance around a simple answer, the simple answer is usually obvious.
China’s BOE (200725.CH), the world’s largest LCD panel producer, is one of the more responsive companies on the Q&A platforms, and while they do the ‘dance’ like many others, they at least attempt to answer questions where others do not.  A recent very simple question prompted a rather lengthy response, which could have easily be summarized in a few words.  Here’s the question and answer, and our summary…
Question
“Hello, is the OLED screen company losing money?  Is it possible to increase the selling price to reduce losses?”
Answer
“Hello! At present, the company's three flexible AMOLED production lines are still in the climbing period, and the newly added depreciation is under pressure in the short term. In the long run, the flexible AMOLED business is one of the company's important growth points in the future. The company has given full play to its advantages in technology and production capacity, and has established extensive and close customer cooperation relationships, and has made important breakthroughs in the development of flexible AMOLED business. According to consulting agency data, in the first quarter of 2022, the company's flexible AMOLED product shipments increased by nearly 50% year-on-year. With the continuous increase in shipments, the operation of the flexible AMOLED business will continue to improve. In the field of smartphones, the company's flexible AMOLED products have basically completed the introduction of global mainstream brand customers in 2021. In the future, it will mainly focus on achieving more product series coverage for customers and continuously increasing the proportion of customers of the company's products. At the same time, continue to promote the application of flexible AMOLED in new fields such as IT and automotive, and enhance the value and performance contribution of flexible AMOLED products. Thanks!”
Summary
“No, not yet.  Not sure when”
In similar fashion, another Chinese panel producer Visionox (002387.CH) was recently queried in a similar fashion also about their OLED display business, although with a bit more detail as follows…
Question
“Thank you very much for the performance forecast.  The estimated loss in the first half of 2022 is about 1.1 billion.  After deducting more than 500 million depreciation from Gu’an in the first half of the year, the loss is basically the same as the same period last year.  Then, while the operating income has increased by about 20%, why has the loss reduction still not achieved except for the solidification.  At present, it is indeed as the majority of investors have said, the more you sell, the more you lose.  Please give a reasonable explanation for the increase in revenue but not profit after deduction of depreciation, thank you!”
Answer
“Thanks for attention.  At present, the AMOLED field is still in a period of rapid development dominated by technology. Due to the ramping production capacity, the continuous improvement of utilization rate, the continuous investment in research and development and the gradual expansion of market demand, the gross profit margin of OLED products is still in the stage of continuous improvement. In 2021, the company's OLED product gross profit margin will increase by 6.6 percentage points year-on-year. In the future, the increase in gross profit will come from economies of scale and industrial synergy. First, the yield rate and utilization rate will be further improved, especially if a relatively sustained high utilization rate can be achieved, the scale advantage of the production line will appear, and various costs and expenses will be Obtain a more reasonable and effective allocation; the second is to continue to build an industrial ecology and strengthen technical coordination. Relying on solid technology accumulation, the company provides a product verification platform, and actively promotes the localization and introduction of upstream supply chains to reduce costs and increase efficiency. Thanks!”
Summary
“No, not yet. Not sure when”
To point, we commend the Chinese exchanges for their push to open public communication between companies and investors, something far more guarded in the US, but we all know companies are going to try to paint the best possible picture, regardless of the actual answer.  While the dance is inevitable, at least there is a sort of a forum, which is a positive step, and on occasion there is some glimmer of useful information given or at least hinted at.  Of course disclosure rules differ from country to country and open Q&A platforms like these can be a minefield for legal counsel, but at least the average investor does not have to wait 90 days to ask a question, if they are able to find a way into the quarterly queue, and the answer, regardless of how obfuscated, is public record.
 
Picture
"Putting Lipstick on a Pig" by Leah Saulnier – Source: fineartamerica.com
0 Comments

Into the Fray?

7/15/2022

0 Comments


Into the Fray?
​

​As far back as April 2021 we noted our thoughts on a mindset change regarding CE component inventory in China.  “Over the last two years, we believe such trade restrictions have changed the way Chinese CE managements look at inventory.  When sourcing was unrestricted, many Chinese CE companies operated under JIT inventory rules, maintaining low inventory levels to keep costs low and avoid end-of-year write-offs.  Once it became apparent that the US trade restrictions would have a real effect on sourcing, Chinese buyers became more aggressive and began building inventory in components that were specified in the US restrictions.  After early January, when it became apparent that the new administration was in no rush to change the government’s stance on such restrictions, Chinese CE companies and OEM/ODMs stepped up ordering to build inventories further, unbalancing the supply chain even further than it already was.”
Later in 2021 we noted that certain components needed for display modules, such as drivers and TCONs (Timing controllers), that had been part of the aggressive inventory building mentioned above, still had not seen the effects of a slowdown in TV panel and set demand, as Chinese OEMs and assemblers were still stockpiling the parts as they assumed IT displays, such as monitors and notebooks would not be part of the slower demand seen for TVs, and prices for those components continued to rise against what was reduced demand. 
Early this year the weakening demand for CE products caught up to CE IT products and prices for IT panels began to fall, considerably faster than most had expected, and suddenly the aggressive inventory accumulation, which had helped OEMs last year during silicon shortages, seemed less necessary, although buyers were relatively slow to adjust purchases and inventories for driver ICs remained relatively high into 2Q.  Now that CE brands have made cuts in orders, pushing panel producers to curtail production, there is now an oversupply in the driver IC sector, with recent expectations of a 3Q price decline of between 8% and 10% and the potential for that to continue through 4Q.  Foundries who had allocated resources away from drivers toward higher margin products last year are now looking to fill potential utilization gaps by filling driver IC contracts while driver buyers are trying to renegotiate those contracts toward lower unit and price levels.
We see these cycles are part of the natural order of things in the CE space but the overstocking seen last year was more than we might have expected.  What was a reaction to the global COVID-19 pandemic in 2020 and the first half of 2021 was seem as the ‘new normal’ by many in the CE space, with a concomitant change in risk assessment, especially regarding inventory, and now, as the ‘new normal’ returns to the old normal, the question is whether the next demand stimulus, whatever it happens to be, will cause the same psychological blind spots across the CE space.  Will lessons be learned or will be bounce right back into another up cycle that will suddenly become an abyss of inventory that buyers were willing to pay anything for months before?  Perhaps the understanding that the politics of trade sanctions and tariffs don’t always work the way intended or have deleterious side effects might make some difference in the next cycle and that striving for market share is not always the way to go might have an impact, but more likely is the endorphin producing mantra that the new normal has finally arrived and the CE space can once again charge into the fray with a willingness to do or pay whatever it takes to squeeze out an extra 0.5% market share.
 
0 Comments

Glass in China – Not as Easy as it Looks

7/14/2022

0 Comments


Glass in China – Not as Easy as it Looks
​

​Given the relatively small number of major display panel producers that supply the CE market, it seems surprising that the number of display glass suppliers that feed such businesses is even smaller, however the cost of building and maintaining the facilities needed to produce this high quality specialized glass is extremely high and limits those who have the financial strength to build and sustain those facilities, and to compete financially in that market.  Dominant players, such as Corning (GLW), AGC (5201.JP), and NEG (5214.JP) have built relationships with display producers, with some glass production lines built alongside display production fabs to facilitate the rapid transport of such large and fragile glass substrates without the need for the extensive packaging needed for long-distance shipments.  As the largest substrate (Gen 11) can run to over 11.5 m2 (118.6 ft2 or eight 65” TV panels) and can be less than a millimeter thick, they are extremely difficult to move and even more difficult to transport to other locations.
Given that the production of LCD TVs is based on glass substrates and that a relatively small (15,000 sheet/month) Gen 8 fab line can produce up to 120,000 65” TVs/month, there is a very significant need for fabs to have both substrate inventory and short-term access to supply as a shortage of glass mass production stops, which not only leads to missed display delivery deadlines but can require equipment resets and recalibration of tools remain idle for an extended period, adding to delays.  Therefore it is incumbent on panel producers to maintain strong relationships with the few glass producers that are able to produce the quality and quantity needed, with those relationships being based on contracts that can specify area, unit volume, or percentage of production requirements, which can create an imbalance in glass supply for smaller panel producers.
In addition to the above, the dominance of Chinese LCD panel producers has intensified the desire of the Chinese government to extricate itself as much as possible from the display supply chain, with a long-term focus on display glass given it underlying importance to the industry.  Over the years the Chinese government, along with provincial and city governments have financed and subsidized an number of projects to build a display glass infrastructure on the Mainland, however it has proven more difficult than expected, both from a technological and from a financial perspective.  Chinese display glass substrate companies have made headway over the years and supply smaller glass sizes to a number of Chinese LCD display fabs, but have note been able to reach the quality and quantity levels needed for larger panel sizes where margins are higher and demand is still growing.
Companies like IRICO (600707.CH) and Dongxu Optroelectronics (000413.CH) have either been funded by the government or partnered with foreign glass producers to develop their own more advanced display glass production facilities in China to less the country’s dependence on foreign glass imports, but not all of those projects have turned out to be as easy as expected, even when paired with Chinese panel producers.  Recently Dongxu Optoelectronics gave guidance of another loss for the 1st six months of this year, and while the loss range was slightly less than last year’s 6 month loss, the company has yet to show a profit after years in the business, indicating that even with tax incentives and operating subsidies, the profitable production of display glass requires much production experience and process knowhow.  Dongxu stated that the reason for the loss was the company’s investment in R&D for the development of display materials, production line costs, and the amortization of intangible and fixed assets during the early stage of expansion, but it also includes interest payments on bank loans and lower sales as the display business contracts.
Further, the company tried to diversify a few years back, expanding into LED based products and glass related automotive products and we believe is one of the automotive glass suppliers to LG Display (LPL), but the company side businesses generated even larger company losses and helped to produce quarterly losses for the company for the last three years.  In 2020 the company refocused on developing a glass product line for OLED displays and lessened its focus on non-glass products but this has done little to stem the losses. In fact Dongxu failed to repay principal and interest on bonds it issued in 2016, which amounts to a bit over $605m in the aggregate and while the company, as part of its expansion, created its own finance company, the company it limited in what it can withdraw from the financing unit.  Dongxu itself has a capital book balance of 9.4b yuan ($1.39b US) but 91.5% of that capital are restricted funds and the book balance of interest bearing liabilities is 24.87b yuan ($3.681b US) of which 8.1b yuan (~$1.2b US) remains unpaid, making it difficult to see how the company can extricate itself from its financial issues.
While the company’s parent Tunghsu Group (pvt) has agreed to buy ‘up to 1.5b yuan worth of shares within six months and the company is working toward extending its debt maturities despite the plan’s initial rejection by shareholders, this all goes to point that throwing money at an industry does not always guarantee dominance or even success, especially in an industry where some of the participants have been suppliers since the industry began  We expect Dongxu to survive in some form given the potential support of Tunghsu Group and potentially the local government given that the company has over 4,000 employees, but the desire for a localized supply chain in a global market is not always the answer to the natural or political conflicts that occur in the course of doing business on an international basis, and while China has been successful in a number of instances in the CE space, nothing is guaranteed.
0 Comments

Asahi Raises Outlook for 1H

7/12/2022

0 Comments


Asahi Raises Outlook for 1H
​

​AGC (5201.JP), aka Asahi Glass, a competitor to Corning (GLW) and NEG (5214.JP), has raised their 1H sales and operating profit guidance.  Sales, which were original forecasted to be ¥870b yen, have moved up by 11.5% to ¥970b and raised its 1H operating profit forecast by 21%.  The new sales forecast is 7.2% above last year’s 1H, while the new Op Profit forecast is up 20.8% over the same period last year.  The original forecast was made by the company on 2/8/22.  While we were hoping that the increase might have been associated with the company’s display glass business, Asahi indicated that the company’s caustic soda (Sodium Hydroxide – NaOH – aka lye) business was positively affected by price increases in the chemical, which is used in paper processing, soap manufacturing, and in the refining of aluminum, along with a number of food preparation processes.   The company also indicated that its PVC (polyvinyl chloride) business, among the top 3 synthetic polymer plastics produced globally, saw higher than expected prices in Southeast Asia during the 1st half.  The company was also able to pass on the higher cost of raw materials and fuel prices to customers in its architectural glass business in Europe.  No mention of the display glass business.  We will likely have to wait until the call next month.
0 Comments

AUO in June – Hints of What’s to Come

7/8/2022

0 Comments


AUO in June – Hints of What’s to Come
​

AU Optronics (2409.TT) reported June Sales of NT$20.69b ($69453m US), ↓5.8% m/m and ↓39.0% y/y, putting the 2nd quarter sales at NT$62.881b ($2.111b US), ↓22.9% q/q and ↓34.3% y/y and 1st half results are ↓19.1% y/y.  Typically (5 year average) June is up 0.4% m/m and 2Q is up 7.0% q/q, so from any perspective June and 2Q were weak for AUO, although no surprising given the weakness seen across the CE space and the display space in particular, as overall display panel prices declined 12.0% during the 2nd quarter and panel orders from brands were reduced.  Area shipped was 1.59m m2, ↓9.7% m/m and we do note (see Figure 2) that AUO has been able to maintain fab efficiency (not utilization), meaning the sales value of each m2 of display produced, at a reasonable level since the beginning of the year, which points to the company’s focus on high value display products rather than generic displays.
While we wait for Innolux (3481.TT) and Hannstar (6116.TT) to report June sales and shipments to complete the Taiwan panel producer data, we expect July results for most panel producers will see further declines, more weighted toward order reductions than price declines, giving a messy start to 3Q.  With Samsung Electronics (005930.KS) reducing or eliminating TV panel orders from suppliers to reduce inventory, as we have previously noted,  it will be difficult for panel producers to maintain production at earlier levels, unless they are willing to offer larger discounts than in previous months, which will amplify panel price declines.  Our hope is that the order cuts will be enough to reduce inventory to more normal levels by mid-August, and that the panel price declines that have been evident for part of last year and the 1st half of 2022 will slow to more ‘normal’ levels as we enter September.  Brand targets have been reduced but consumers have yet to jump at discounts thus far, and the macro environment leaves a bit to be desired, so again we look at such prospects as possible but less probable than an extension of the current CE malaise into 4Q.  As of yet there are few signs pointing toward a better than expected outcome, but we keep looking.
 
Picture
AU Optronics - Monthly Sales - 2018 - 2022 YTD - Source: SCMR LLC, Company Data
Picture
AU Optronics - Sales Per M2 - Source: SCMR LLC, Company Data
0 Comments
<<Previous
Forward>>

    Author

    We publish daily notes to clients.  We archive selected notes here, please contact us at: ​[email protected] for detail or subscription information.

    Archives

    May 2025
    April 2025
    March 2025
    February 2025
    January 2025
    January 2024
    November 2023
    October 2023
    September 2023
    August 2023
    June 2023
    May 2023
    February 2023
    January 2023
    December 2022
    November 2022
    October 2022
    September 2022
    August 2022
    July 2022
    June 2022
    May 2022
    April 2022
    March 2022
    February 2022
    January 2022
    December 2021
    November 2021
    October 2021
    September 2021
    August 2021
    July 2021
    June 2021
    May 2021
    April 2021
    March 2021
    February 2021
    January 2021
    December 2020
    October 2020
    July 2020
    May 2020
    November 2019
    April 2019
    January 2019
    January 2018
    August 2017
    July 2017
    June 2017
    May 2017
    April 2017
    March 2017
    February 2017
    January 2017
    November 2016
    October 2016
    September 2016

    Categories

    All
    5G
    8K
    Aapl
    AI
    AMZN
    AR
    ASML
    Audio
    AUO
    Autonomous Engineering
    Bixby
    Boe
    China Consumer Electronics
    China - Consumer Electronics
    Chinastar
    Chromebooks
    Components
    Connected Home
    Consumer Electronics General
    Consumer Electronics - General
    Corning
    COVID
    Crypto
    Deepfake
    Deepseek
    Display Panels
    DLB
    E-Ink
    E Paper
    E-paper
    Facebook
    Facial Recognition
    Foldables
    Foxconn
    Free Space Optical Communication
    Global Foundries
    GOOG
    Hacking
    Hannstar
    Headphones
    Hisense
    HKC
    Huawei
    Idemitsu Kosan
    Igzo
    Ink Jet Printing
    Innolux
    Japan Display
    JOLED
    LEDs
    Lg Display
    Lg Electronics
    LG Innotek
    LIDAR
    Matter
    Mediatek
    Meta
    Metaverse
    Micro LED
    Micro-LED
    Micro-OLED
    Mini LED
    Misc.
    MmWave
    Monitors
    Nanosys
    NFT
    Notebooks
    Oled
    OpenAI
    QCOM
    QD/OLED
    Quantum Dots
    RFID
    Robotics
    Royole
    Samsung
    Samsung Display
    Samsung Electronics
    Sanan
    Semiconductors
    Sensors
    Sharp
    Shipping
    Smartphones
    Smart Stuff
    SNE
    Software
    Tariffs
    TCL
    Thaad
    Tianma
    TikTok
    TSM
    TV
    Universal Display
    Visionox
    VR
    Wearables
    Xiaomi

    RSS Feed

Site powered by Weebly. Managed by Bluehost